
In my last post, I wrote about how I used a free online tool from Nielsen to research basic demographic information for potential taphouse locations. Today I want to show how I used another free online tool to gather more detailed information about the same locations.
![]()
Because I am a resident of King County here in beautiful Washington State, I have access to the King County Library System. If you are a resident of King County and are considering starting a business, run out and get yourself a library card if you don’t already have one. Online, you can verify that you are in the KCLS service area and apply for a card, though you’ll obtain your card faster if you go into a KCLS location and fill out an application in-person. Many of the research tools provided by the library system are not really affordable for individuals and small businesses, so kudos to KCLS for buying subscriptions and making them available to their patrons online!
If you are not within the KCLS service area, check with the library systems in your area to see if they offer SimplyMap or other similar products.
On the KCLS home page, I scrolled down and clicked on the “Databases” link found under the “Browse for…” header. On the next page, I selected the link for “Business, Economics & Investing”. There are a number of databases available here. KCLS provides YouTube videos to help you use of some of these tools. I selected the link for SimplyMap.
There was a learning curve with SimplyMap, but the YouTube video helped a lot. I started by selecting a location. Here is the list of locations I researched in my last post:
- 98001 (Auburn)
- 98002 (Auburn)
- 98092 (Auburn)
- 98010 (Black Diamond)
- 98038 (Maple Valley)
- 98042 (Maple Valley)
- 98027 (Issaquah)
- 98029 (Issaquah)
I clicked on the “Locations” tab, then selected “Find location by: Zip Codes” and entered the first zip from the list, 98001, then clicked the “Use this location” button. A little box popped up at the bottom of the screen to let me know that the location was selected, but otherwise I couldn’t tell that I had accomplished anything.
Next I clicked on the “Variables” tab. This is where I got to pick from some awesome data sets. One of the categories listed is Consumer Expenditure — how much money people spend on things. That sounded like something I’d like to know, so I selected it. Then it prompted me for a “Folder”, so I selected 2010 to get the most recent map data. The list for 2010 expanded to offer about a dozen industry types. I chose “Food”, because it seemed to most closely match my business. Food expanded into three subcategories, one of which was “Alcoholic Beverages”. That expanded into two more categories, from which I selected “Away from Home”. Finally, an actual list of variables appeared, one of which was “Beer and ale away (Household Average)”. That sounds like some good data to me, so I selected it. Another little box popped up at the bottom of the screen, but otherwise nothing changed.

There must be a better way to display this information.
It took me a while to realize that, in the background, the map had populated with the information I requested. To actually see the map I had to close the window I’d been using to select the location and variable. The resulting map was fugly to look at. I could have tweaked the colors in the tool if I wanted to pretty it up. From here it was just a matter of associating the color of the zip code with the numbers in the legend, which in this case reads “52.76 – 55.22”. Unfortunately, I have no idea what those numbers mean!
I poked around in the help and did some searching online, but I was unable to find anything to help me clarify exactly what this data means. If you know, please leave a comment. Because the numbers in the legend range from 0 – 100, I assumed they represent percentages. So, approximately 54% of households in the zip code 98001 went out and had a beer in the past year? That’s what we’ll say until someone tells me otherwise.

New column on the sheet: Beer and Ale Away %
I recorded the data for the rest of my target zip codes and stepped back for a look. It didn’t actually go into the level of detail that I had hoped, but one thing did stand out: Auburn looks like an even worse option than it did before. Not only do the Auburn zip codes have lower incomes and lower spending, but when they do spend their money it doesn’t seem to be on beer. Conversely, Maple Valley and Issaquah have beer spending habits at the top of the range.
The other variable I wanted to look at was how much money these potential customers typically spent on beer. These numbers were even less telling.
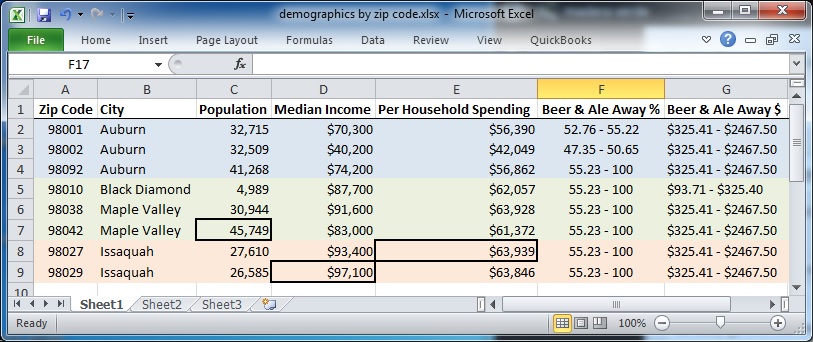
New column on the sheet: Beer and Ale Away $
Fortunately the map can be broken down into smaller chunks called block groups, and by looking at that data I can identify areas within the zip code that spend more on beer. Theoretically, these areas are where I should be looking to locate the taphouse.
After some fiddling around, I was able to create custom locations in SimplyMap that grouped together my common zip codes. This pic shows the block groups within the highlighted 98010, 98038 and 98042 zip codes, and the amount of money they spent on beer away from home.

This view shows better detail about who is spending the most money on beer.
There is a lot more data available here. In my next post I’ll be looking closer at the buying habits of my target markets.

Pingback: Research: Demographics and Location | madera verde